With 2025 in the rear-view, we’re taking a look at how evictions continue to shape rental housing in the region and across the state. From January to September 2025, Hampton Roads saw 35,582 eviction filings, essentially flat compared to last year, but down from the region’s pandemic highs.
The Top 10 Evictors
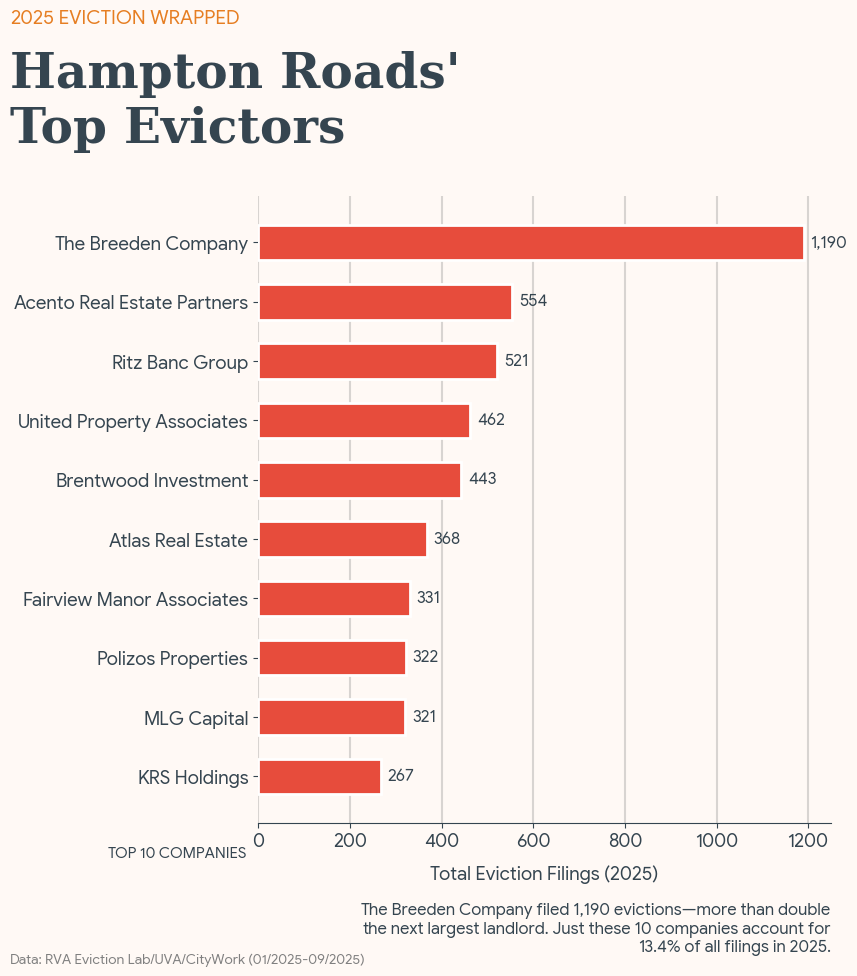
The Breeden Company takes the crown as Hampton Roads’ Top Evictor of 2025 for the third year in a row. In the first nine months of 2025, Breeden was responsible for 1,190 filings, not just under its corporate name, but spread across a web of property-level LLCs and management entities that appear in court filings as separate plaintiffs. That fragmentation makes a single institutional actor look like dozens of different landlords.
Breeden has become the region’s unchecked hegemon of evictions, filing more than double the cases of its next closest competitor, Acento Real Estate Partners.
2. Nearly 40% of Evictions are Filed by Investment Firms
A small slice of the market is driving a huge share of eviction activity. Just 123 investor landlords are responsible for nearly 40% of all eviction filings in Hampton Roads in 2025.
Put another way, roughly 2.5% of landlords that filed for evictions last year accounted for nearly 40% of all filings.
It’s easy to miss this if you’re only looking at court records. On paper, the region has close to 4,500 distinct plaintiff names filing evictions. But many of those landlords are shell entities, or property-level LLCs used by the same parent firm. For instance, the 123 investor owners we identified operated through at least 282 distinct plaintiff entities, which fractures their footprint and makes accountability harder.
Take Ritz Banc Group, the region’s #3 evictor. You won’t see “Ritz Banc Group” consistently on the docket. Instead, they appear through a family of shell plaintiffs like:
· RBG BV Associates LLC (
· RBG Hickory Point Associates
· RBG Beacon 303
· …and more.
When a tiny fraction of owners can generate nearly 40% of all filings, eviction can’t be understood only as a one-off response to missed rent. What we are seeing is the result of evictions embedded in the business model of financialized rental housing.
What we are seeing is the result of evictions embedded in the business model of financialized rental housing.
This stat is, mildly, a bit striking. So to explain how we arrived at this number, to quantify investor-driven filings, we linked docket plaintiff names to our Hampton Roads Landlord Atlas using a fuzzy matching workflow. We first standardized plaintiff names, then used a token-set ratio matching algorithm to connect each unique plaintiff name to the Atlas’ ownership data. To avoid false positives, we only accepted high confidence matches ≥95/100 and excluded borderline matches (90–94) confidence. This means the 40% figure is more likely an undercount than an overcount.
3. Where are Eviction Patterns Emerging?
Zooming out to look at the entire state of Virginia. I was curious if the biggest evictors in Virginia show up together in clusters of neighboring zip codes, or are their footprints scattered across the state?
This matters because if a same small set of high-volume plaintiffs repeatedly show up in the same contiguous areas, eviction functions less less like a diffuse administrative process and more like a spatial pattern of concentrated institutional pressure, meaning it can be targeted not only through statewide legal reform, but through place-based organizing and intervention.
Two ZIPs in the south Richmond / Chesterfield corridor emerge as hot spots. Here four to five of the state’s top evictors overlap in the same small area, surrounded by a wider “metro halo” of ZIPs with one to three top evictors present.
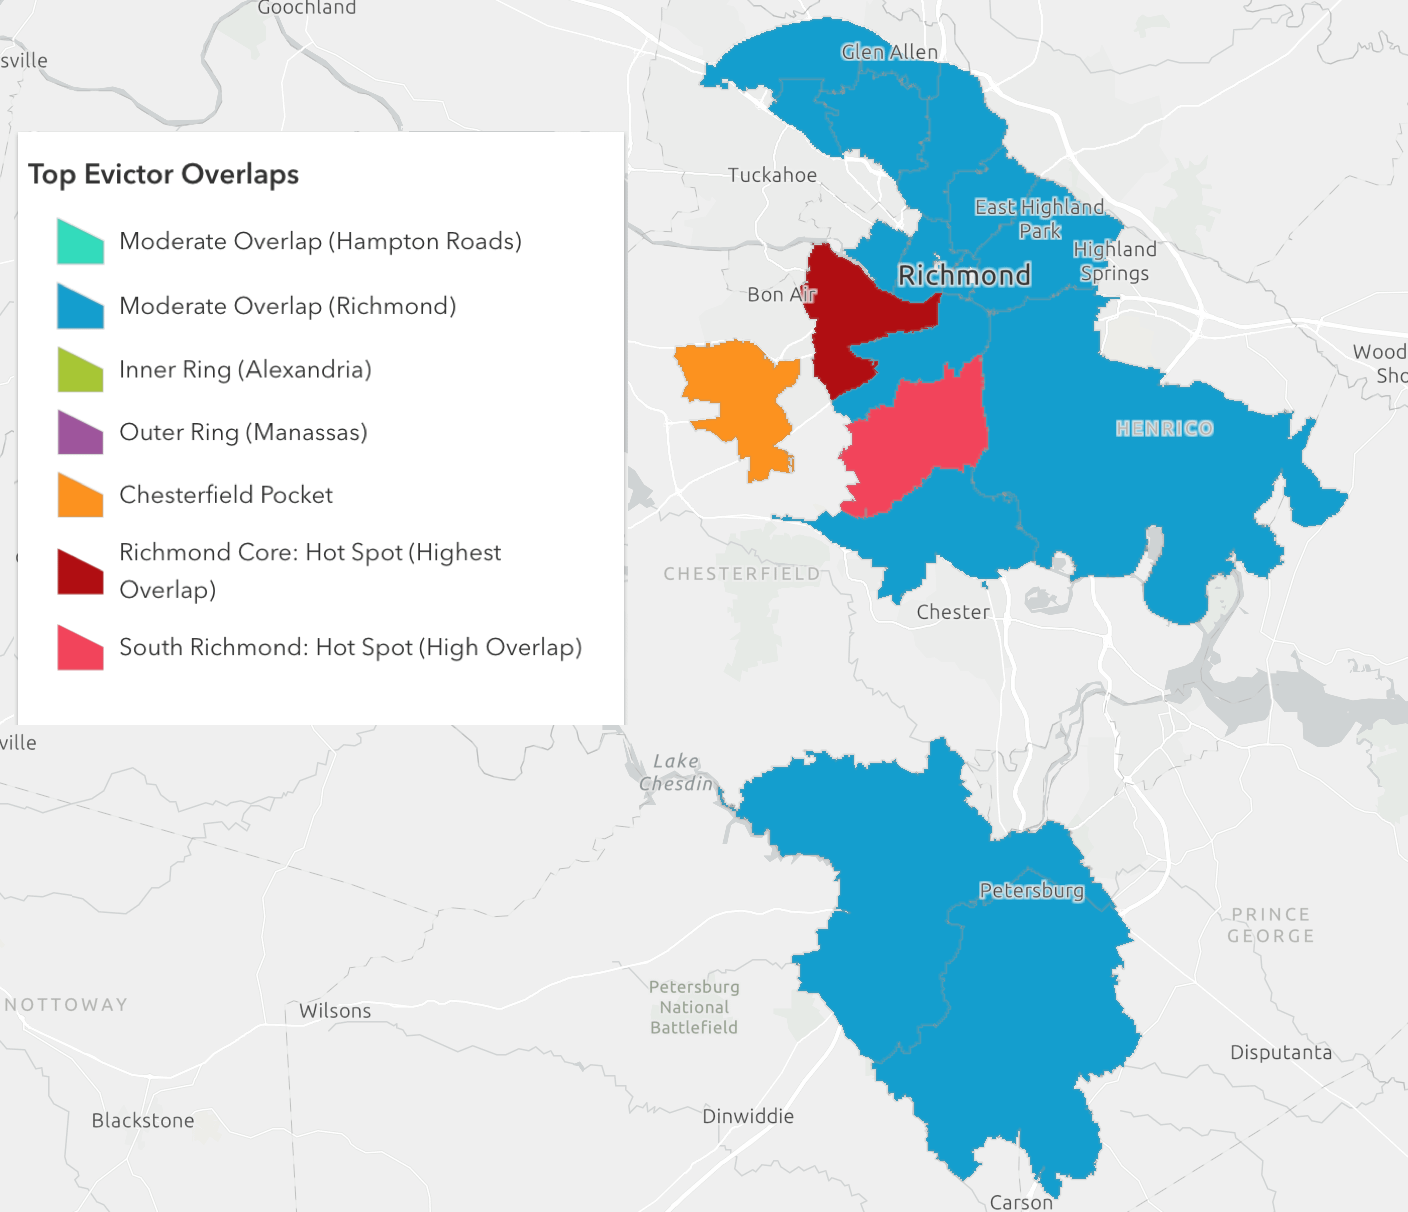
Hampton Roads forms another contiguous pocket, and Northern Virginia splits into two rings—an inner ring(Arlington/Alexandria) and an outer ring (Woodbridge/Manassas), though whether this reflects different corporate landlords or different portfolio concentrations within the same firms isn’t super clear from filing data alone.
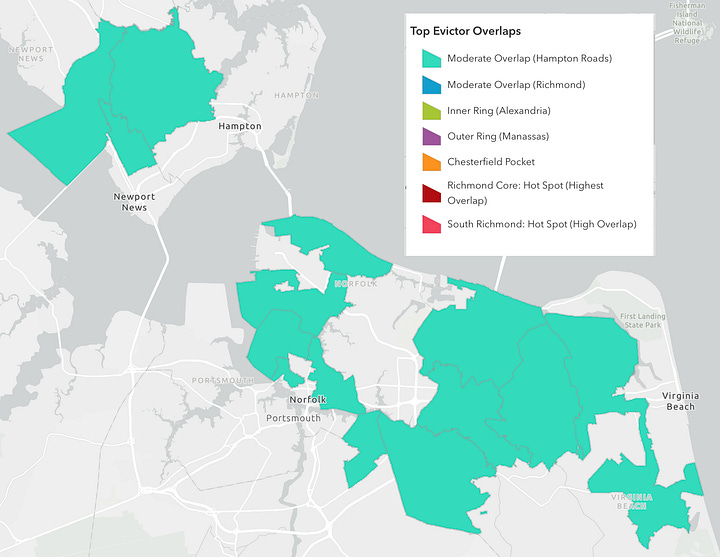
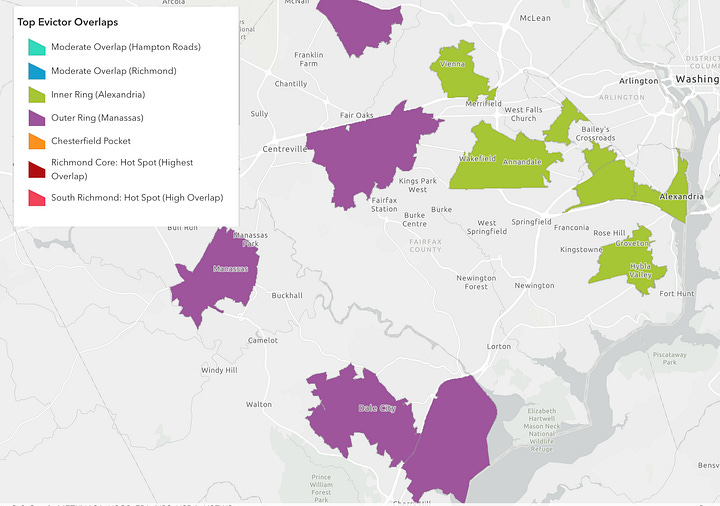
Data note: I tried to make sure these pockets weren’t just reflecting where renters live, to account for that I tested how strongly renter density predicts exposure. The correlation was weak (r=0.36), meaning renter density explains only about 13% of the pattern. Additionally, I ran a spatial clustering test (Global Moran’s I = 0.31, p = 0.001) which confirmed that the eviction clusters themselves are statistically significant and non-random. Taken together, these tests suggest the patterns are not merely byproducts of population density, but distinct zones of institutional activity.
What emerges from this data is a shift in how we should understand evictions. Eviction appears less as an extraordinary legal remedy and more as a built-in feature of financialized rental housing, where displacement risk itself becomes a lever of revenue extraction. We can no longer think of eviction as the failure of a tenant, but a feature of the investor landlord business model. For the region's largest firms, the court summons is hardly a last resort but a routine mechanism for extracting revenue at scale.